Machining tool operators
set up and operate metal-cutting machines designed for repetitive machining work.
On This Page

Full NOC Description
Main Duties
- This group performs some or all of the following duties:
- Study job orders and interpret blueprints to determine machining operations to be performed
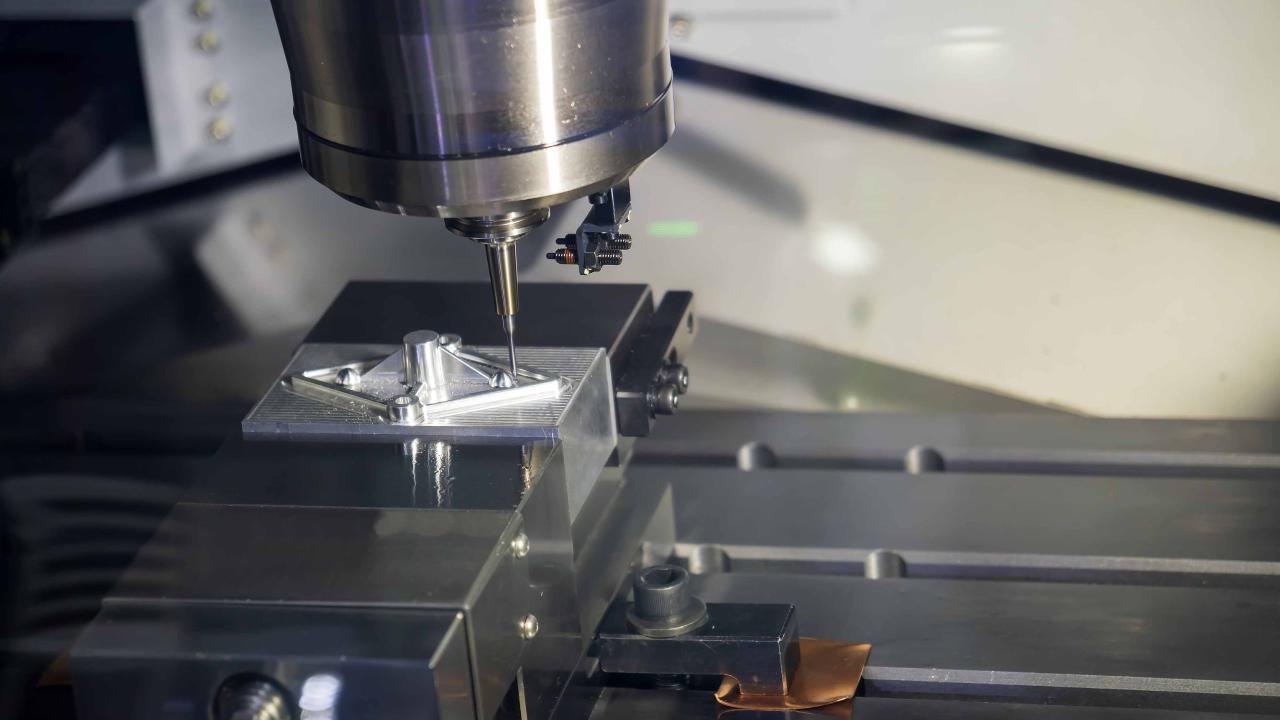
- Set up and operate machine tools to perform repetitive machining operations, such as turning, milling, drilling, boring, planing, honing, broaching, grinding or other machining operations
- Verify dimensions of parts machined using micrometers, callipers and other precision measuring instruments
- Prepare etching solution and immerse metal parts or workpiece in etching solution to remove unwanted portions
- Perform routine maintenance on equipment and machinery
- May enter codes specifying speed, feed and cut of the toolpath for computer numerical controlled (CNC) machine tools.
Also Known As
- aircraft parts etcher
- boring mill operator - metal machining
- computer numerical control (CNC) machining tool operator
- lathe machining operator
- machining tool operator
Employment Requirements
- Secondary school education is required.
- College or other courses in machining may be required.
- Several weeks of on-the-job training are provided.
- Senior positions in this unit group, such as set-up operator, require experience as a machine operator.
Provincial Regulation
Not Provincially Regulated
The following graph shows the percentage of men and women working in this occupation in New Brunswick.
Data legend
The following graph shows the breakdown of all persons working in this occupation in New Brunswick by age group.
Data legend
The following graph shows the breakdown of all persons working in this occupation in New Brunswick by highest level of education achieved.
Data legend
The following graph shows the industry groups in which the largest shares of persons working in this occupation in New Brunswick are employed. Small percentages for all top three industry groups may suggest employment for this occupation is widely distributed amongst many industry groups.
Data legend
The following graph shows the breakdown of all persons employed in this occupation in New Brunswick by which economic region they reside in.
Data legend

Economic Regions
The following map displays New Brunswick’s five economic regions. An economic region (ER) is a grouping of counties, created as a standard unit for analysis of regional economic activity across Canada.
The following graph shows the average salary of all persons employed in this occupation in each of New Brunswick’s five economic regions.
Data legend
Economic Regions
The following map displays New Brunswick’s five economic regions. An economic region (ER) is a grouping of counties, created as a standard unit for analysis of regional economic activity across Canada.
The following represents the median hourly wage of all persons employed in this occupation in each of New Brunswick’s five economic regions.
The following shows the average salary of everyone who worked full-time and year-round in this occupation across each of the Atlantic Provinces and nationally.
The following represents the number of job openings that are expected to occur in this occupation over the next three and ten years respectively, broken down by openings expected to result from growth (“new jobs”) and openings expected to result from attrition (death and retirements).
Share this page
No endorsement of any products or services is expressed or implied.