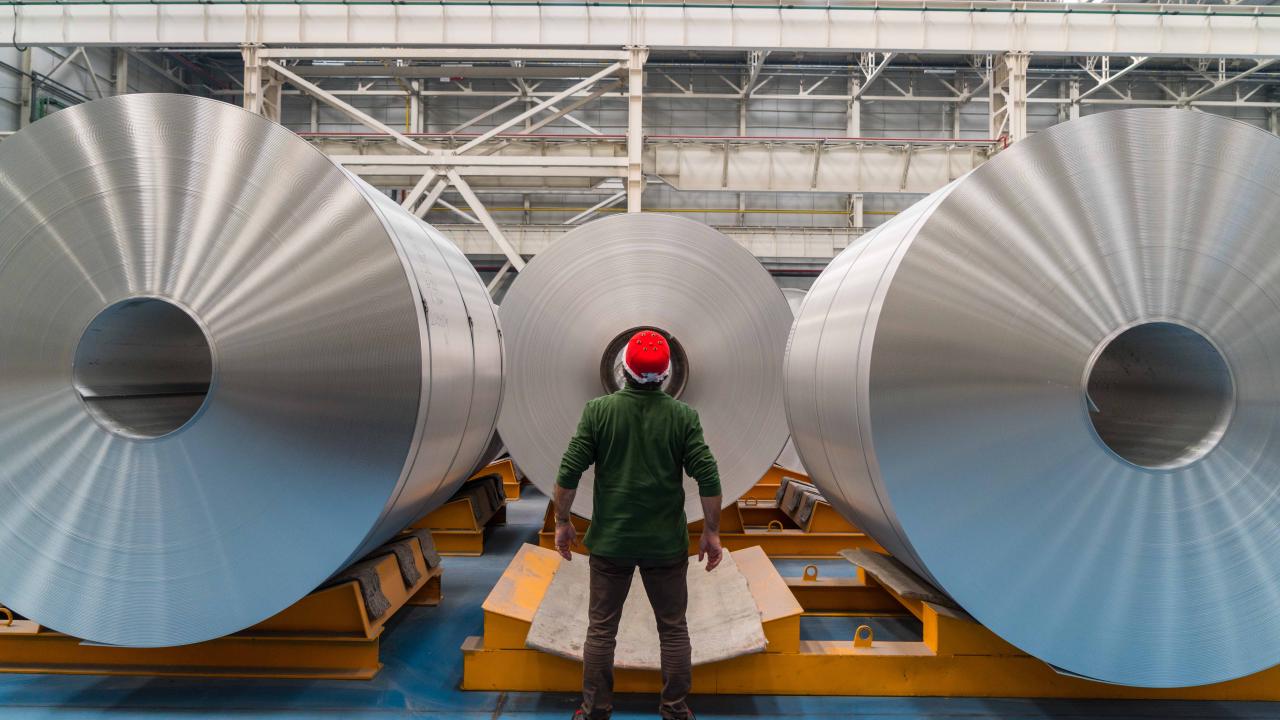
Labourers in mineral and metal processing
perform material handling, clean-up, packaging and other basic activities related to mineral ore and metal processing.
On This Page

Full NOC Description
Main Duties
- This group performs some or all of the following duties:
- Transport raw materials, finished products, scrap and recyclable materials throughout plant manually or using forklift or other powered equipment
- Feed conveyors, crushers and other equipment; open valves and start pumps; skim dross from furnaces; sort, stack, bundle and stamp materials; and perform other activities to assist process and machine operators in mineral ore and metal processing
- Clean work areas and equipment
- May assist with minor repairs and maintenance.
Also Known As
- asbestos worker - mineral processing
- brick and tile kiln cleaner
- core shop labourer - foundry
- extrusion helper - primary metal processing
- fibreglass oven charger helper
Employment Requirements
- Completion of secondary school may be required for some positions in this group.
Provincial Regulation
Not Provincially Regulated
The following graph shows the percentage of men and women working in this occupation in New Brunswick.
Data legend
The following graph shows the breakdown of all persons working in this occupation in New Brunswick by age group.
Data legend
The following graph shows the breakdown of all persons working in this occupation in New Brunswick by highest level of education achieved.
Data legend
The following graph shows the industry groups in which the largest shares of persons working in this occupation in New Brunswick are employed. Small percentages for all top three industry groups may suggest employment for this occupation is widely distributed amongst many industry groups.
Data legend
The following graph shows the breakdown of all persons employed in this occupation in New Brunswick by which economic region they reside in.
Data legend

Economic Regions
The following map displays New Brunswick’s five economic regions. An economic region (ER) is a grouping of counties, created as a standard unit for analysis of regional economic activity across Canada.
The following graph shows the average salary of all persons employed in this occupation in each of New Brunswick’s five economic regions.
Data legend
Economic Regions
The following map displays New Brunswick’s five economic regions. An economic region (ER) is a grouping of counties, created as a standard unit for analysis of regional economic activity across Canada.
The following represents the median hourly wage of all persons employed in this occupation in each of New Brunswick’s five economic regions.
The following shows the average salary of everyone who worked full-time and year-round in this occupation across each of the Atlantic Provinces and nationally.
The following represents the number of job openings that are expected to occur in this occupation over the next three and ten years respectively, broken down by openings expected to result from growth (“new jobs”) and openings expected to result from attrition (death and retirements).
Share this page
No endorsement of any products or services is expressed or implied.