Woodworking machine operators
set up, program and operate woodworking machines to fabricate or repair wooden parts for furniture, fixtures or other wood products.
On This Page

Full NOC Description
Main Duties
- This group performs some or all of the following duties:
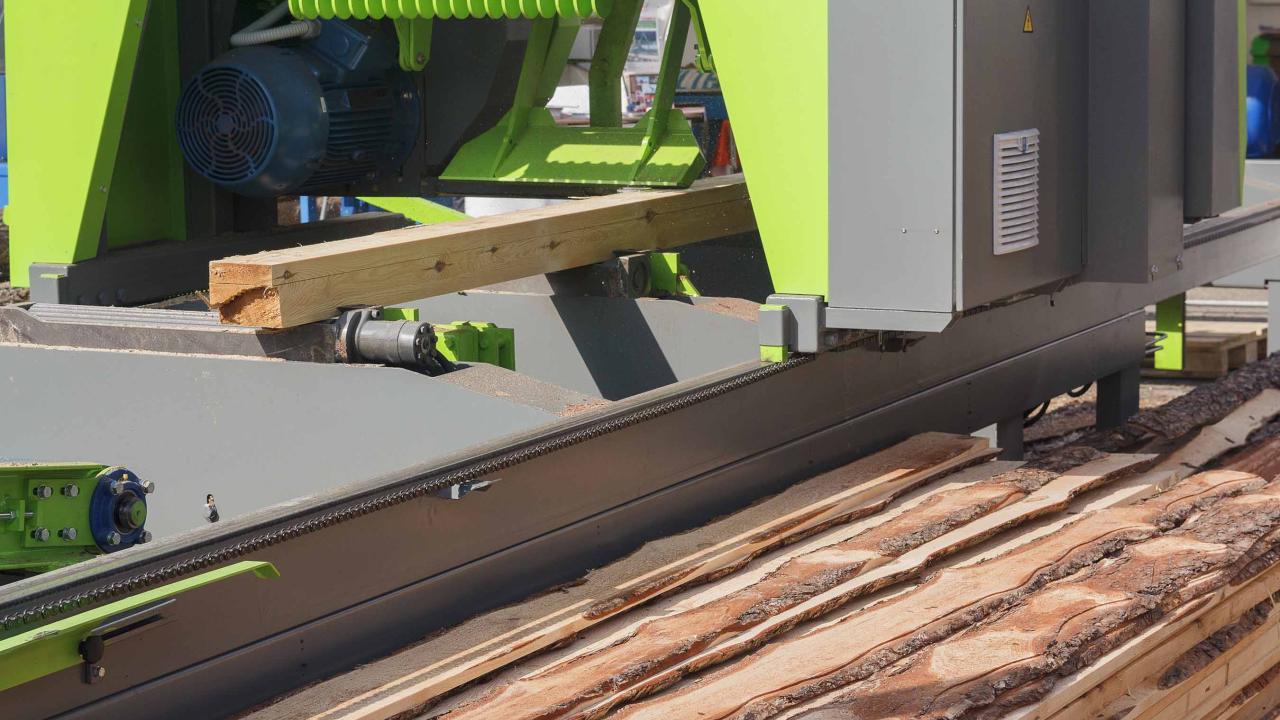
- Set up, program and operate one or more computer numerically controlled (CNC) or manual woodworking machines such as saws, moulders, lathes, routers, planers, edgers, pressing machines, shapers, drills and sanders to fabricate or repair wooden parts for furniture, fixtures and other wood products
- Operate gluing machines to glue pieces of wood together or press and affix wood veneer to wood surfaces
- Operate preset special-purpose woodworking machines to fabricate wood products such as coat hangers, mop handles, clothes pins and other products
- Read and interpret specifications or follow verbal instructions
- May clean and lubricate equipment, and replace parts as necessary.
Also Known As
- boring machine operator - woodworking
- computer numerically controlled (CNC) band saw operator
- drill operator - woodworking
- drum sander - woodworking
- edge bander operator - woodworking
Employment Requirements
- Some secondary school education is usually required.
- On-the-job training is usually provided.
- Experience as a labourer in the same company may be required.
Provincial Regulation
Not Provincially Regulated
The following graph shows the percentage of men and women working in this occupation in New Brunswick.
Data legend
The following graph shows the breakdown of all persons working in this occupation in New Brunswick by age group.
Data legend
The following graph shows the breakdown of all persons working in this occupation in New Brunswick by highest level of education achieved.
Data legend
The following graph shows the industry groups in which the largest shares of persons working in this occupation in New Brunswick are employed. Small percentages for all top three industry groups may suggest employment for this occupation is widely distributed amongst many industry groups.
Data legend
The following graph shows the breakdown of all persons employed in this occupation in New Brunswick by which economic region they reside in.
Data legend

Economic Regions
The following map displays New Brunswick’s five economic regions. An economic region (ER) is a grouping of counties, created as a standard unit for analysis of regional economic activity across Canada.
The following graph shows the average salary of all persons employed in this occupation in each of New Brunswick’s five economic regions.
Data legend
Economic Regions
The following map displays New Brunswick’s five economic regions. An economic region (ER) is a grouping of counties, created as a standard unit for analysis of regional economic activity across Canada.
The following represents the median hourly wage of all persons employed in this occupation in each of New Brunswick’s five economic regions.
The following shows the average salary of everyone who worked full-time and year-round in this occupation across each of the Atlantic Provinces and nationally.
The following represents the number of job openings that are expected to occur in this occupation over the next three and ten years respectively, broken down by openings expected to result from growth (“new jobs”) and openings expected to result from attrition (death and retirements).
Share this page
No endorsement of any products or services is expressed or implied.