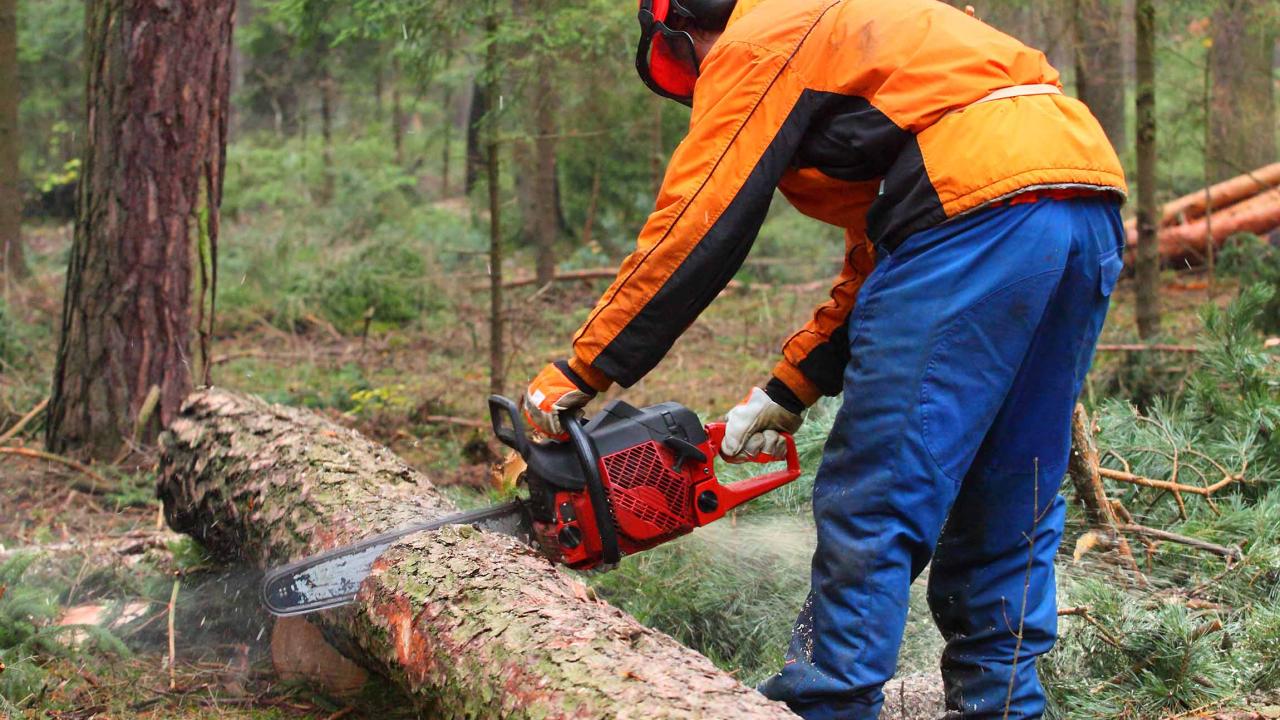
Chain saw and skidder operators
use chain saws to fell, delimb and cut trees to length, and operate skidders to move felled trees to landing areas for processing and transportation.
On This Page

Full NOC Description
Main Duties
- This group performs some or all of the following duties:
- Operate chain saw to fell, delimb and buck trees at the logging site and loading area
- Operate cable, or grapple skidder to move or yard the felled trees from the logging site to the landing area for processing and transportation
- Assess site, terrain and weather conditions before felling and yarding trees
- May work as member of a team rotating between chain saw operation and skidder operation
- May maintain and perform minor repairs on skidders, chain saws and other equipment.
Also Known As
- bucker
- chain saw operator - logging
- faller
- feller
- forest worker - logging
Employment Requirements
- Completion of secondary school may be required.
- Completion of a college program for forest workers may be required.
- Formal training in chain saw operation and maintenance and several months of on-the-job training are usually provided.
- Previous experience as a logging and forestry labourer or logging machine operator may be required. Experience requirements vary depending on the type and location of woodlands operations.
- Provincial certification or a forest worker program certificate is required in some provinces.
- Trade certification for fallers is available, but voluntary in Quebec.
- Workplace hazardous materials information system (WHMIS) and first aid certificates may be required.
Provincial Regulation
Not Provincially Regulated
The following graph shows the percentage of men and women working in this occupation in New Brunswick.
Data legend
The following graph shows the breakdown of all persons working in this occupation in New Brunswick by age group.
Data legend
The following graph shows the breakdown of all persons working in this occupation in New Brunswick by highest level of education achieved.
Data legend
The following graph shows the industry groups in which the largest shares of persons working in this occupation in New Brunswick are employed. Small percentages for all top three industry groups may suggest employment for this occupation is widely distributed amongst many industry groups.
Data legend
The following graph shows the breakdown of all persons employed in this occupation in New Brunswick by which economic region they reside in.
Data legend

Economic Regions
The following map displays New Brunswick’s five economic regions. An economic region (ER) is a grouping of counties, created as a standard unit for analysis of regional economic activity across Canada.
The following graph shows the average salary of all persons employed in this occupation in each of New Brunswick’s five economic regions.
Data legend
Economic Regions
The following map displays New Brunswick’s five economic regions. An economic region (ER) is a grouping of counties, created as a standard unit for analysis of regional economic activity across Canada.
The following represents the median hourly wage of all persons employed in this occupation in each of New Brunswick’s five economic regions.
The following shows the average salary of everyone who worked full-time and year-round in this occupation across each of the Atlantic Provinces and nationally.
The following represents the number of job openings that are expected to occur in this occupation over the next three and ten years respectively, broken down by openings expected to result from growth (“new jobs”) and openings expected to result from attrition (death and retirements).
Share this page
No endorsement of any products or services is expressed or implied.