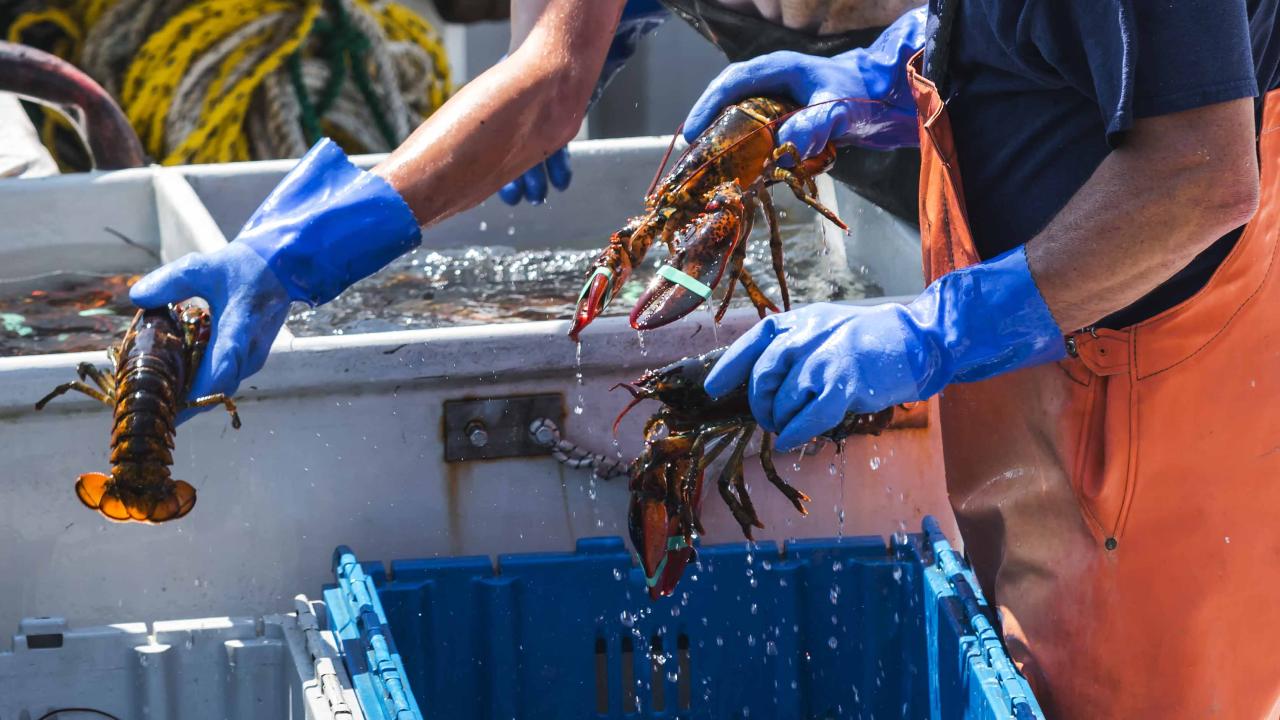
Fishermen / women
- Fishermen/women
operate fishing vessels less than 100 gross tonnes to harvest fish and other marine life. They are usually self-employed owner-operators of fishing vessels.
On This Page

Full NOC Description
Main Duties
- This group performs some or all of the following duties:
- Operate fishing vessel to pursue and catch fish and other marine life
- Select area for fishing, plot courses and compute navigational positions using compasses and charts or electronic fishing aids
- Steer vessel and operate navigational instruments
- Operate fishing gear, direct fishing operation and supervise fishing crew members
- Maintain engine, fishing gear and other on-board equipment
- Record fishing activities, weather and sea conditions
- Estimate costs of operations and plan budget for each fishing season
- Establish fish marketing plan and keep records of all financial transactions
- May transport fish to processing plants or fish buyers.
Also Known As
- fisherman/woman
- fishing vessel skipper
- inshore fisherman/woman
- lobster fisherman/woman
- longliner fisherman/woman
Employment Requirements
- Several years of experience as fishing vessel crew member or helper are usually required.
- Marine Emergency Duties Certificate is required by Transport Canada.
- A valid Fishing Vessel Operator Certificate is required.
- A commercial fishing licence is required.
- Licences are required for each species of fish pursued.
- Trade certification for fish harvesters is available, but voluntary, in Newfoundland and Labrador.
Provincial Regulation
Not Provincially Regulated
The following graph shows the percentage of men and women working in this occupation in New Brunswick.
Data legend
The following graph shows the breakdown of all persons working in this occupation in New Brunswick by age group.
Data legend
The following graph shows the breakdown of all persons working in this occupation in New Brunswick by highest level of education achieved.
Data legend
The following graph shows the industry groups in which the largest shares of persons working in this occupation in New Brunswick are employed. Small percentages for all top three industry groups may suggest employment for this occupation is widely distributed amongst many industry groups.
Data legend
The following graph shows the breakdown of all persons employed in this occupation in New Brunswick by which economic region they reside in.
Data legend

Economic Regions
The following map displays New Brunswick’s five economic regions. An economic region (ER) is a grouping of counties, created as a standard unit for analysis of regional economic activity across Canada.
The following graph shows the average salary of all persons employed in this occupation in each of New Brunswick’s five economic regions.
Data legend
Economic Regions
The following map displays New Brunswick’s five economic regions. An economic region (ER) is a grouping of counties, created as a standard unit for analysis of regional economic activity across Canada.
The following represents the median hourly wage of all persons employed in this occupation in each of New Brunswick’s five economic regions.
The following shows the average salary of everyone who worked full-time and year-round in this occupation across each of the Atlantic Provinces and nationally.
The following represents the number of job openings that are expected to occur in this occupation over the next three and ten years respectively, broken down by openings expected to result from growth (“new jobs”) and openings expected to result from attrition (death and retirements).
Share this page
No endorsement of any products or services is expressed or implied.