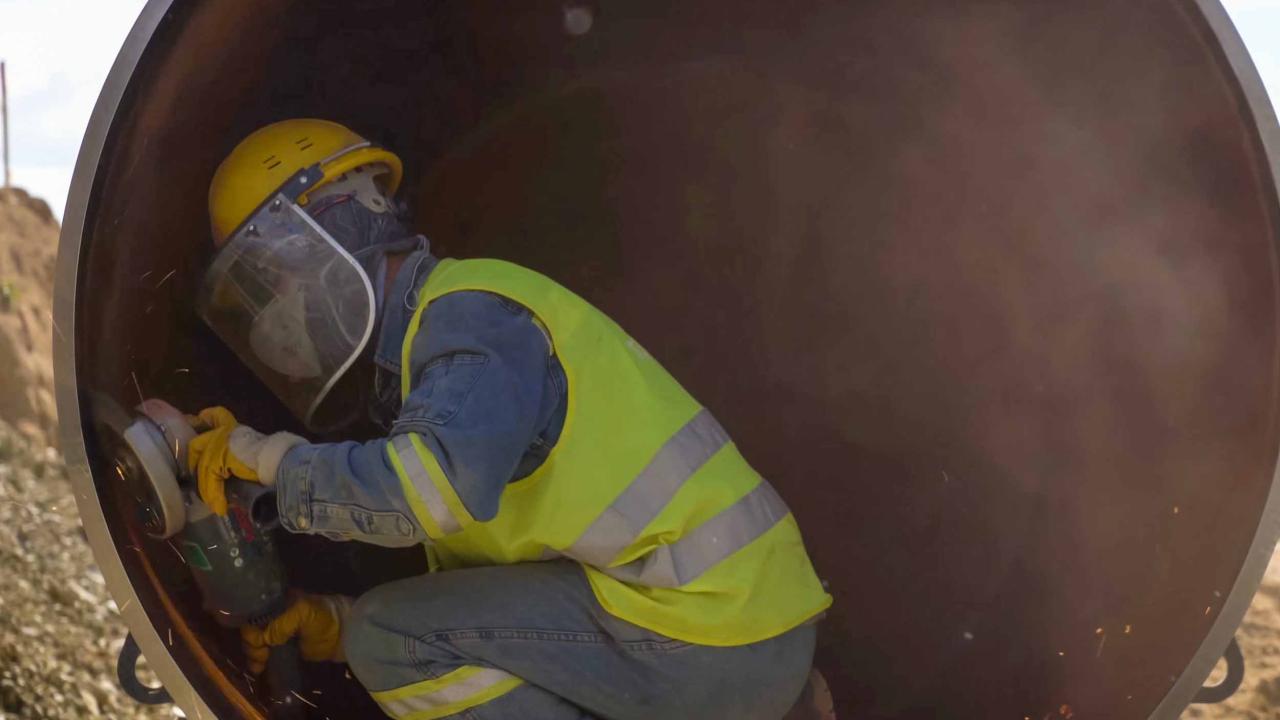
Structural metal and platework fabricators and fitters
fabricate, assemble, fit and install steel or other metal components for buildings, bridges, tanks, towers, boilers and other similar structures and products.
On This Page

Full NOC Description
Main Duties
- This group performs some or all of the following duties:
- Study engineering drawings and blueprints, determine the materials required, and plan the sequence of tasks to cut metal most efficiently
- Construct patterns and templates as guides for layouts
- Lay out reference points and patterns on heavy metal according to component specifications
- Rig, hoist and move materials to storage areas or within worksite
- Assemble and fit metal sections and plates to form complete units or subunits using tack welding, bolting, riveting or other methods
- Set up and operate various heavy-duty metal-working machines such as brake presses, shears, cutting torches, grinders and drills, including computer numerical control (CNC) equipment, to bend, cut, form, punch, drill or otherwise form heavy-metal components
- Install fabricated components in final product.
Also Known As
- metal fabricator
- plater
- platework fitter
- shipfitter
- shipfitter apprentice
Employment Requirements
- Completion of secondary school is usually required.
- Completion of a three- to four-year apprenticeship program or A combination of over four years of work experience in the trade and some college or industry courses in structural steel and platework fabrication is usually required to be eligible for trade certification.
- Trade certification for metal fabricators (fitters) is available, but voluntary, in all provinces.
- Trade certification for marine technicians is available, but voluntary, in Nova Scotia and British Columbia.
- Trade certification for piledriver and bridgeworker is available in British Columbia.
- Trade certification for boiler and related equipment assemblers and structural metal fabricators (non-construction) is available, but voluntary, in Quebec.
- Red Seal endorsement is also available to qualified metal fabricators (fitters) upon successful completion of the interprovincial Red Seal examination.
Provincial Regulation
- Provincially Regulated: Yes
- Compulsory: No
- Red Seal: Yes
Regulation Body
The following graph shows the percentage of men and women working in this occupation in New Brunswick.
Data legend
The following graph shows the breakdown of all persons working in this occupation in New Brunswick by age group.
Data legend
The following graph shows the breakdown of all persons working in this occupation in New Brunswick by highest level of education achieved.
Data legend
The following graph shows the industry groups in which the largest shares of persons working in this occupation in New Brunswick are employed. Small percentages for all top three industry groups may suggest employment for this occupation is widely distributed amongst many industry groups.
Data legend
The following graph shows the breakdown of all persons employed in this occupation in New Brunswick by which economic region they reside in.
Data legend

Economic Regions
The following map displays New Brunswick’s five economic regions. An economic region (ER) is a grouping of counties, created as a standard unit for analysis of regional economic activity across Canada.
The following graph shows the average salary of all persons employed in this occupation in each of New Brunswick’s five economic regions.
Data legend
Economic Regions
The following map displays New Brunswick’s five economic regions. An economic region (ER) is a grouping of counties, created as a standard unit for analysis of regional economic activity across Canada.
The following represents the median hourly wage of all persons employed in this occupation in each of New Brunswick’s five economic regions.
The following shows the average salary of everyone who worked full-time and year-round in this occupation across each of the Atlantic Provinces and nationally.
The following represents the number of job openings that are expected to occur in this occupation over the next three and ten years respectively, broken down by openings expected to result from growth (“new jobs”) and openings expected to result from attrition (death and retirements).
Share this page
No endorsement of any products or services is expressed or implied.