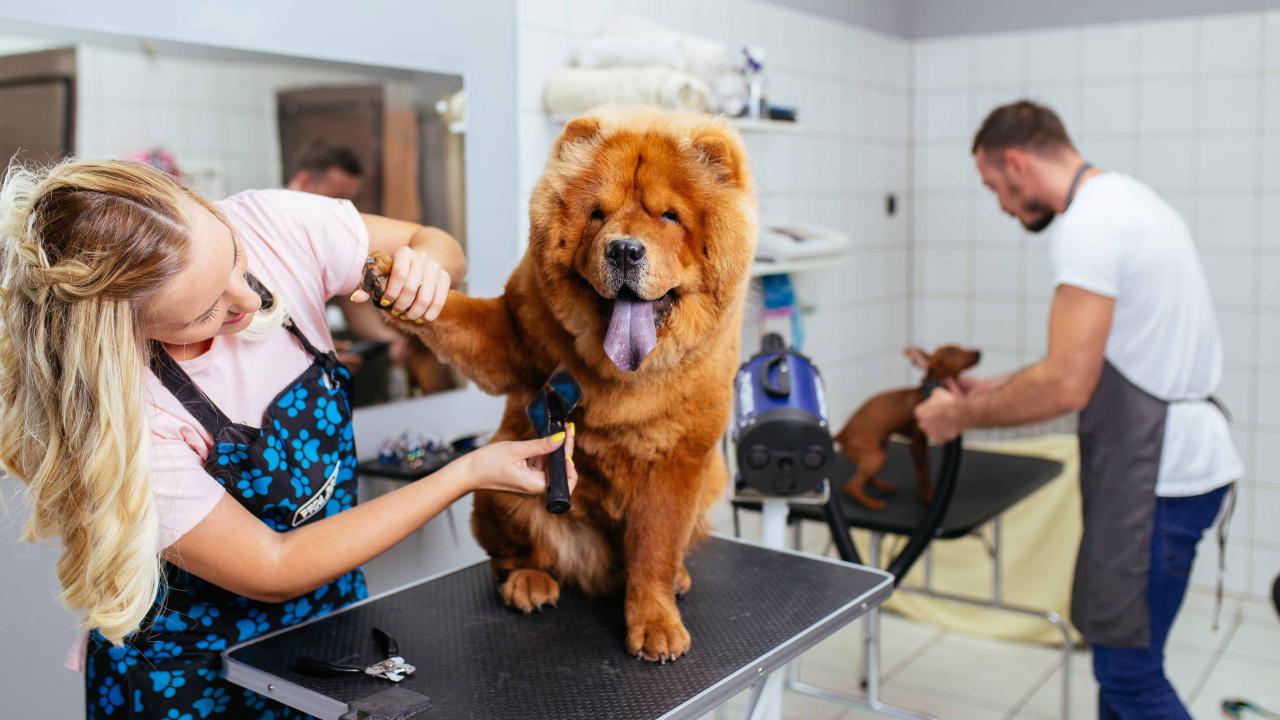
Pet groomers and animal care workers
Pet groomers bathe, clip and groom pets. Animal care workers feed, handle, train and groom animals and assist veterinarians, technicians and breeders.
On This Page

Full NOC Description
Main Duties
- This group performs some or all of the following duties:
- Prepare food and feed animals, fish or birds at scheduled intervals
- Clean and disinfect cages, pens and surrounding areas
- Shampoo, clip and groom animals
- Assist veterinarians and animal health technologists and technicians to inoculate and treat animals
- Assist animal breeders to handle and nurture animals
- Assist scientists and researchers in conducting laboratory tests with animals
- Monitor and document animal behaviour
- Train dogs to obey commands and perform specific duties in response to signals.
Also Known As
- animal care worker (except farm)
- dog groomer
- dog trainer
- kennel attendant
- laboratory animal attendant
Employment Requirements
- Completion of secondary school is usually required.
- Depending on the type of work performed, training courses in animal handling, grooming or dog training are usually required. Animal health or veterinary assistant college courses may be required for animal care workers.
Provincial Regulation
Not Provincially Regulated
The following graph shows the percentage of men and women working in this occupation in New Brunswick.
Data legend
The following graph shows the breakdown of all persons working in this occupation in New Brunswick by age group.
Data legend
The following graph shows the breakdown of all persons working in this occupation in New Brunswick by highest level of education achieved.
Data legend
The following graph shows the industry groups in which the largest shares of persons working in this occupation in New Brunswick are employed. Small percentages for all top three industry groups may suggest employment for this occupation is widely distributed amongst many industry groups.
Data legend
The following graph shows the breakdown of all persons employed in this occupation in New Brunswick by which economic region they reside in.
Data legend

Economic Regions
The following map displays New Brunswick’s five economic regions. An economic region (ER) is a grouping of counties, created as a standard unit for analysis of regional economic activity across Canada.
The following graph shows the average salary of all persons employed in this occupation in each of New Brunswick’s five economic regions.
Data legend
Economic Regions
The following map displays New Brunswick’s five economic regions. An economic region (ER) is a grouping of counties, created as a standard unit for analysis of regional economic activity across Canada.
The following represents the median hourly wage of all persons employed in this occupation in each of New Brunswick’s five economic regions.
The following shows the average salary of everyone who worked full-time and year-round in this occupation across each of the Atlantic Provinces and nationally.
The following represents the number of job openings that are expected to occur in this occupation over the next three and ten years respectively, broken down by openings expected to result from growth (“new jobs”) and openings expected to result from attrition (death and retirements).
Share this page
No endorsement of any products or services is expressed or implied.