Meat cutters and fishmongers
- Meat cutters and fishmongers - retail and wholesale
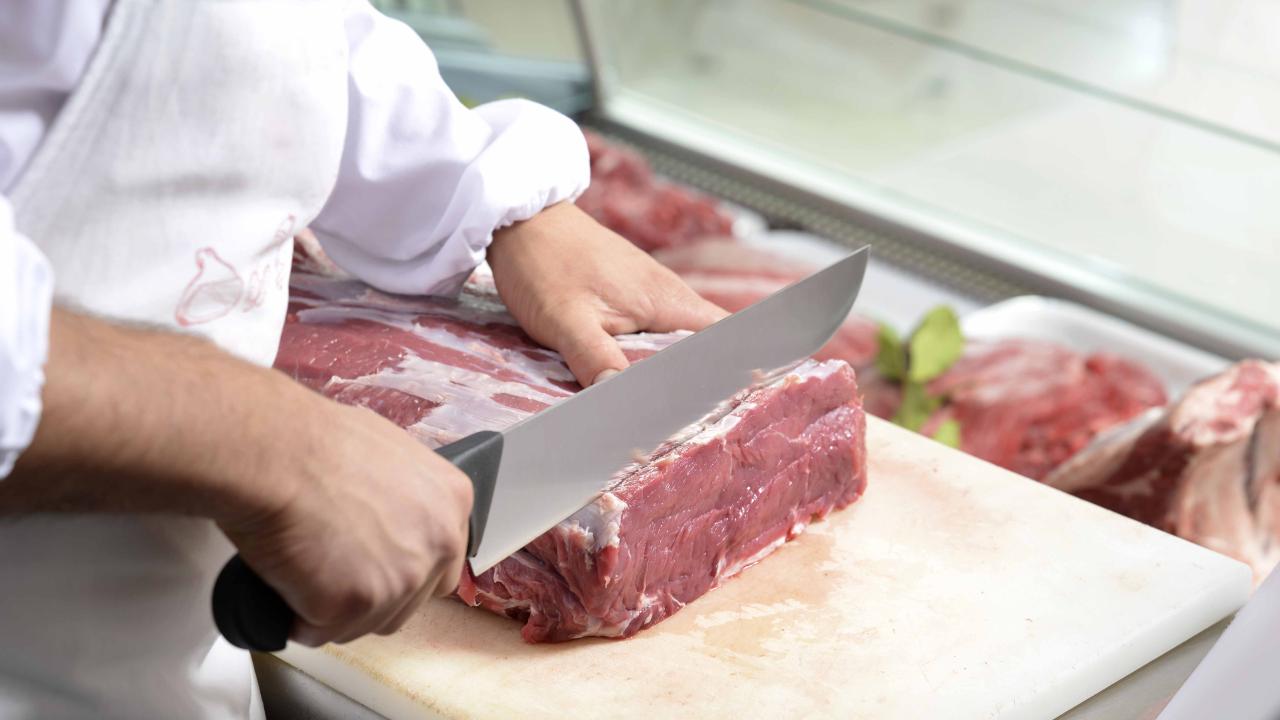
cut, trim, prepare and package pieces of meat, poultry and fish that are sold by food retailers or wholesalers.
On This Page

Full NOC Description
Main Duties
- This group performs some or all of the following duties:
- Grind meats and slice cooked meats using powered grinders and slicing machines
- Cut, weigh, package, label and price meat, meat products, fish and seafood for sale
- Suggest complementary and/or alternative meat or fish products to consumers
- Inspect the quality of meat, fish and seafood, expiry dates and ensure proper product rotation
- Ensure the maintenance of equipment, displays and work area
- Receive and store merchandise in accordance with the company's established standards
- Comply with government health and safety standards and occupational health and safety standards.
Also Known As
- fishmonger
- fishmonger - retail
- meat cutter - retail or wholesale
- supermarket meat cutter
Employment Requirements
- Completion of secondary school may be required.
- On-the-job training in food stores is usually offered to meat cutters and fishmongers for retail sale.
- An apprenticeship program in meat cutting is available but voluntary.
- Trade certification for meat cutter is available, but voluntary, in Saskatchewan and British Columbia.
Provincial Regulation
Not Provincially Regulated
The following graph shows the percentage of men and women working in this occupation in New Brunswick.
Data legend
The following graph shows the breakdown of all persons working in this occupation in New Brunswick by age group.
Data legend
The following graph shows the breakdown of all persons working in this occupation in New Brunswick by highest level of education achieved.
Data legend
The following graph shows the industry groups in which the largest shares of persons working in this occupation in New Brunswick are employed. Small percentages for all top three industry groups may suggest employment for this occupation is widely distributed amongst many industry groups.
Data legend
The following graph shows the breakdown of all persons employed in this occupation in New Brunswick by which economic region they reside in.
Data legend

Economic Regions
The following map displays New Brunswick’s five economic regions. An economic region (ER) is a grouping of counties, created as a standard unit for analysis of regional economic activity across Canada.
The following graph shows the average salary of all persons employed in this occupation in each of New Brunswick’s five economic regions.
Data legend
Economic Regions
The following map displays New Brunswick’s five economic regions. An economic region (ER) is a grouping of counties, created as a standard unit for analysis of regional economic activity across Canada.
The following represents the median hourly wage of all persons employed in this occupation in each of New Brunswick’s five economic regions.
The following shows the average salary of everyone who worked full-time and year-round in this occupation across each of the Atlantic Provinces and nationally.
The following represents the number of job openings that are expected to occur in this occupation over the next three and ten years respectively, broken down by openings expected to result from growth (“new jobs”) and openings expected to result from attrition (death and retirements).
Share this page
No endorsement of any products or services is expressed or implied.