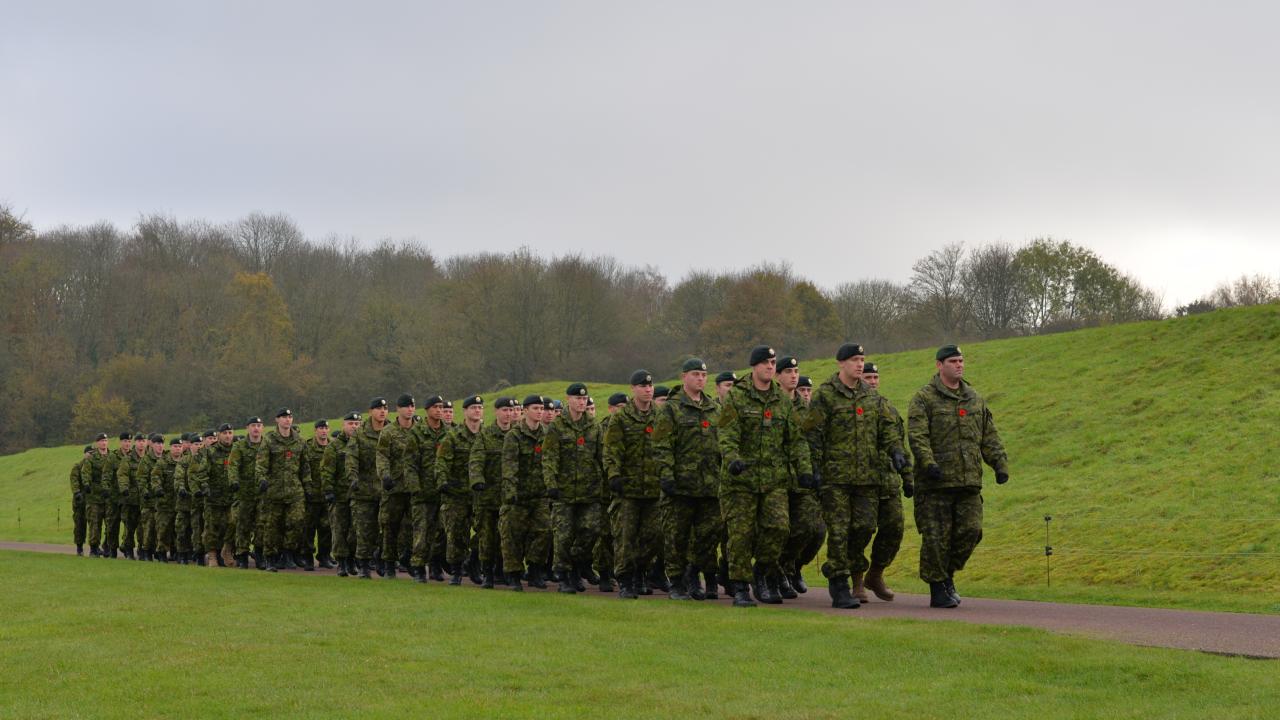
Primary combat members of the Canadian Armed Forces
provide defence measures to protect Canadian waters, land, air space and other interests. They conduct raids and ambushes in combat missions and conduct patrols and escorts in security and stability missions.
On This Page

Full NOC Description
Main Duties
- This group performs some or all of the following duties:
- Provide assistance in emergency situations, such as civil disorder, natural disasters and major accidents
- Operate armoured vehicles, artillery, hand-held weapons and other military combat equipment and defense systems
- Engage in non-combat operations for humanitarian efforts
- Participate in drills and other training in preparation for peacekeeping, combat and natural disaster relief
- Maintain weapon systems, vehicles, survival gear and personal defensive equipment
- Perform underwater search and recovery operations
- Use tactics of camouflage and concealment, patrol, attack, defense, and evasion when engaged in combat missions.
Also Known As
- armoured soldier - Canadian Army
- infanteer
- infantry soldier
- soldier - Canadian Army
Employment Requirements
- Completion of secondary school is usually required.
- Three months of basic military training is required and provided.
- Specialized training in the operation of military equipment and systems is provided.
Provincial Regulation
Not Provincially Regulated
The following graph shows the percentage of men and women working in this occupation in New Brunswick.
Data legend
The following graph shows the breakdown of all persons working in this occupation in New Brunswick by age group.
Data legend
The following graph shows the breakdown of all persons working in this occupation in New Brunswick by highest level of education achieved.
Data legend
The following graph shows the industry groups in which the largest shares of persons working in this occupation in New Brunswick are employed. Small percentages for all top three industry groups may suggest employment for this occupation is widely distributed amongst many industry groups.
Data legend
The following graph shows the breakdown of all persons employed in this occupation in New Brunswick by which economic region they reside in.
Data legend

Economic Regions
The following map displays New Brunswick’s five economic regions. An economic region (ER) is a grouping of counties, created as a standard unit for analysis of regional economic activity across Canada.
The following graph shows the average salary of all persons employed in this occupation in each of New Brunswick’s five economic regions.
Data legend
Economic Regions
The following map displays New Brunswick’s five economic regions. An economic region (ER) is a grouping of counties, created as a standard unit for analysis of regional economic activity across Canada.
The following represents the median hourly wage of all persons employed in this occupation in each of New Brunswick’s five economic regions.
The following shows the average salary of everyone who worked full-time and year-round in this occupation across each of the Atlantic Provinces and nationally.
The following represents the number of job openings that are expected to occur in this occupation over the next three and ten years respectively, broken down by openings expected to result from growth (“new jobs”) and openings expected to result from attrition (death and retirements).
Share this page
No endorsement of any products or services is expressed or implied.