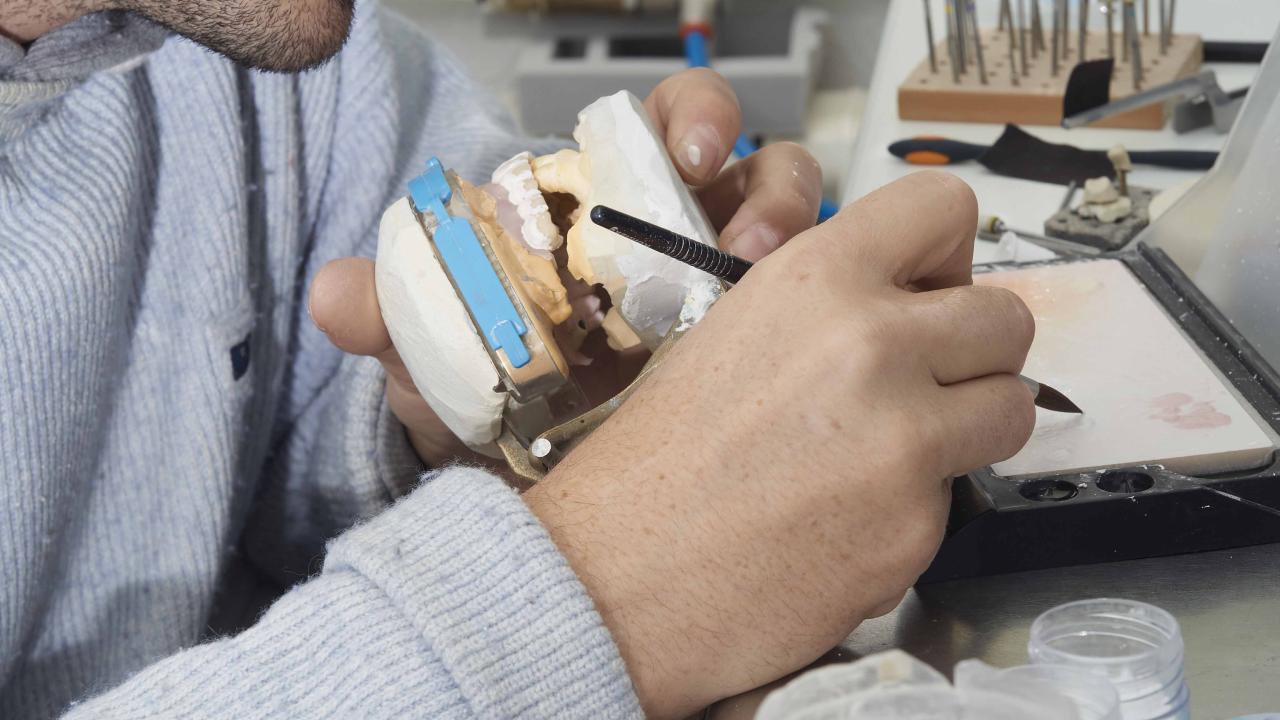
Dental technologists and technicians
prepare and fabricate dentures and dental devices as prescribed by dentists and other specialists.
On This Page

Full NOC Description
Main Duties
- This group performs some or all of the following duties:
- Design, fabricate, modify or repair dental devices including full or partial dentures, orthodontic appliances, crowns, bridges, inlays, onlays, clasps and bands, and implants
- Ensure proper handling and control of hazardous materials, and adhere to laboratory infection control procedures as required
- May consult with dentists or other specialists on problematic dental cases
- May train and supervise other dental technicians and dental laboratory assistants in fabricating dentures and other dental devices
- May conduct research in the science, techniques and practice of dental technology
- May perform administrative functions for the dental laboratory.
Also Known As
- dental technician
- dental technician supervisor
- dental technologist
- registered dental technician (RDT)
- registered dental technologist (RDT)
Employment Requirements
- Dental technologists and technicians are required to complete a college program in dental technology or four or more years of on-the-job training under the supervision of a registered dental technologist or technician.
- Registration with a regulatory body is required for dental technologists and technicians in all provinces except in Manitoba and the territories.
Provincial Regulation
- Provincially Regulated: Yes
Regulation Body
The following graph shows the percentage of men and women working in this occupation in New Brunswick.
Data legend
The following graph shows the breakdown of all persons working in this occupation in New Brunswick by age group.
Data legend
The following graph shows the breakdown of all persons working in this occupation in New Brunswick by highest level of education achieved.
Data legend
The following graph shows the industry groups in which the largest shares of persons working in this occupation in New Brunswick are employed. Small percentages for all top three industry groups may suggest employment for this occupation is widely distributed amongst many industry groups.
Data legend
The following graph shows the breakdown of all persons employed in this occupation in New Brunswick by which economic region they reside in.
Data legend

Economic Regions
The following map displays New Brunswick’s five economic regions. An economic region (ER) is a grouping of counties, created as a standard unit for analysis of regional economic activity across Canada.
The following graph shows the average salary of all persons employed in this occupation in each of New Brunswick’s five economic regions.
Data legend
Economic Regions
The following map displays New Brunswick’s five economic regions. An economic region (ER) is a grouping of counties, created as a standard unit for analysis of regional economic activity across Canada.
The following represents the median hourly wage of all persons employed in this occupation in each of New Brunswick’s five economic regions.
The following shows the average salary of everyone who worked full-time and year-round in this occupation across each of the Atlantic Provinces and nationally.
The following represents the number of job openings that are expected to occur in this occupation over the next three and ten years respectively, broken down by openings expected to result from growth (“new jobs”) and openings expected to result from attrition (death and retirements).
Share this page
No endorsement of any products or services is expressed or implied.