
Cashiers
operate cash registers, price scanners, computers or other equipment to record and accept payment for the purchase of goods and services.
On This Page
Full NOC Description
Cashiers operate cash registers, optical price scanners, computers or other equipment to record and accept payment for the purchase of goods, services and admissions. They are employed in stores, restaurants, theatres, recreational and sports establishments, currency exchange booths, government offices, business offices and other service, retail and wholesale establishments.
Main Duties
This group performs some or all of the following duties:
- Greet customers
- Establish or identify price of goods, services or admission and tabulate total payment required using electronic or other cash register, optical price scanner or other equipment
- Weigh produce and bulk foods
- Receive and process payments by cash, cheque, credit card or automatic debit
- Wrap or place merchandise in bags
- Provide information to customers
- Assist sports spectators and theatre patrons with seat selection
- Calculate foreign currency exchange
- Calculate total payments received at end of work shift and reconcile with total sales
- Verify the age of customers when selling lottery tickets, alcohol or tobacco products
- May accept reservations and take-out orders
- May also stock shelves and clean check-out counter area.
Also Known As
- box office cashier
- cafeteria cashier
- grocery store cashier
- movie theatre cashier
- office cashier
Employment Requirements
- Some secondary school education is usually required. High school diploma may be required by some employers.
- A casino gaming licence may be required for cashiers working in gambling casinos.
Provincial Regulation
Not Provincially Regulated
The following graph shows the percentage of men and women working in this occupation in New Brunswick.
Data legend
The following graph shows the breakdown of all persons working in this occupation in New Brunswick by age group.
Data legend
The following graph shows the breakdown of all persons working in this occupation in New Brunswick by highest level of education achieved.
Data legend
The following graph shows the industry groups in which the largest shares of persons working in this occupation in New Brunswick are employed. Small percentages for all top three industry groups may suggest employment for this occupation is widely distributed amongst many industry groups.
Data legend
The following graph shows the breakdown of all persons employed in this occupation in New Brunswick by which economic region they reside in.
Data legend

Economic Regions
The following map displays New Brunswick’s five economic regions. An economic region (ER) is a grouping of counties, created as a standard unit for analysis of regional economic activity across Canada.
The following graph shows the average salary of all persons employed in this occupation in each of New Brunswick’s five economic regions.
Data legend
Economic Regions
The following map displays New Brunswick’s five economic regions. An economic region (ER) is a grouping of counties, created as a standard unit for analysis of regional economic activity across Canada.
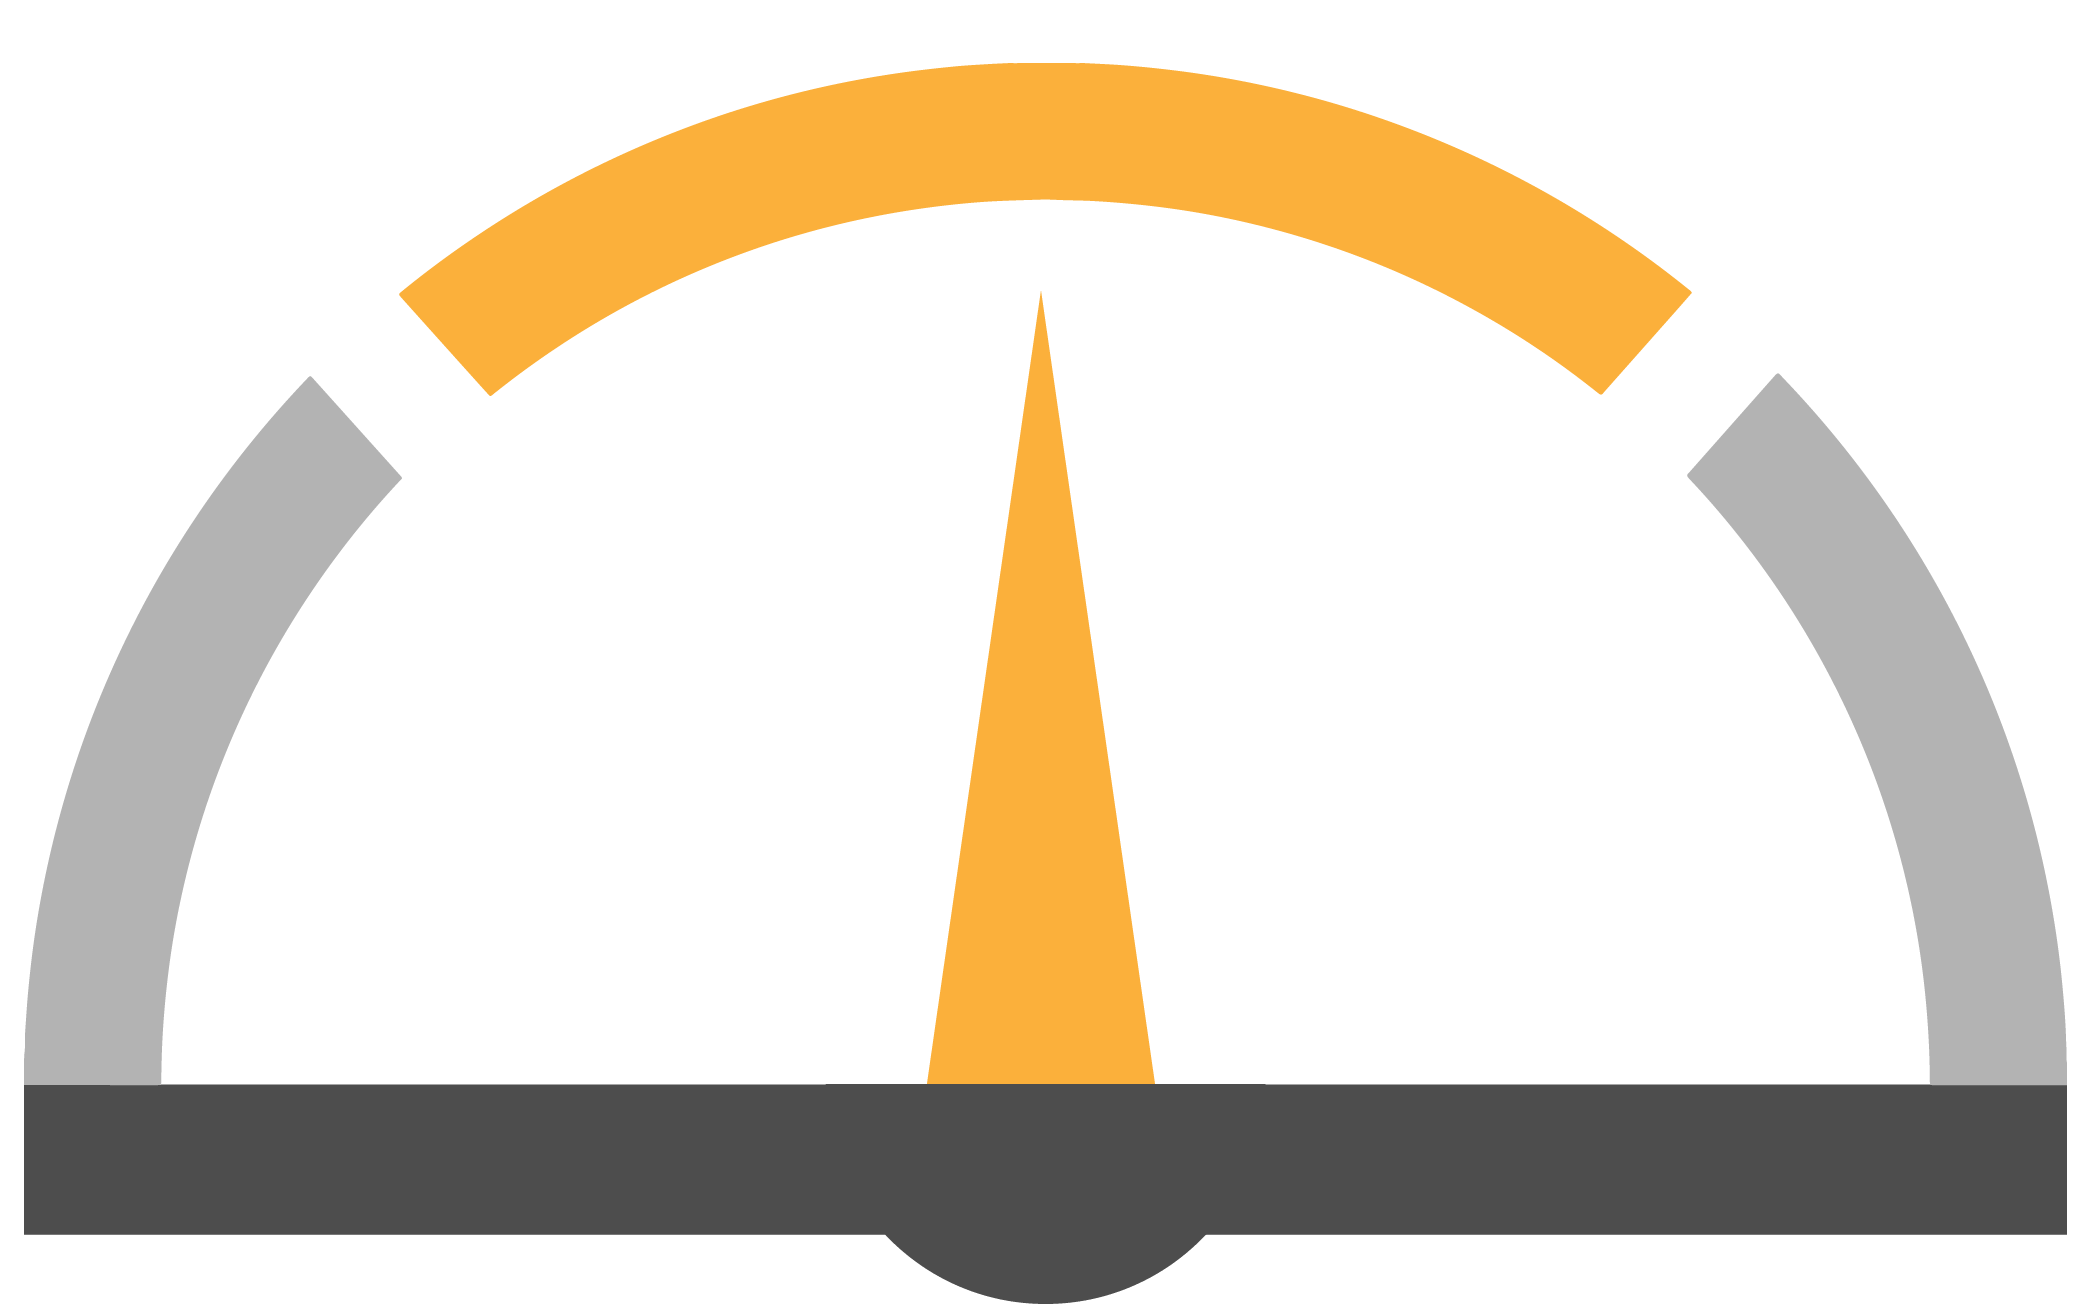
The following represents the median hourly wage of all persons employed in this occupation in each of New Brunswick’s five economic regions.
The following shows the average salary of everyone who worked full-time and year-round in this occupation across each of the Atlantic Provinces and nationally.
The following represents the number of job openings that are expected to occur in this occupation over the next three and ten years respectively, broken down by openings expected to result from growth (“new jobs”) and openings expected to result from attrition (death and retirements).
Share this page
No endorsement of any products or services is expressed or implied.