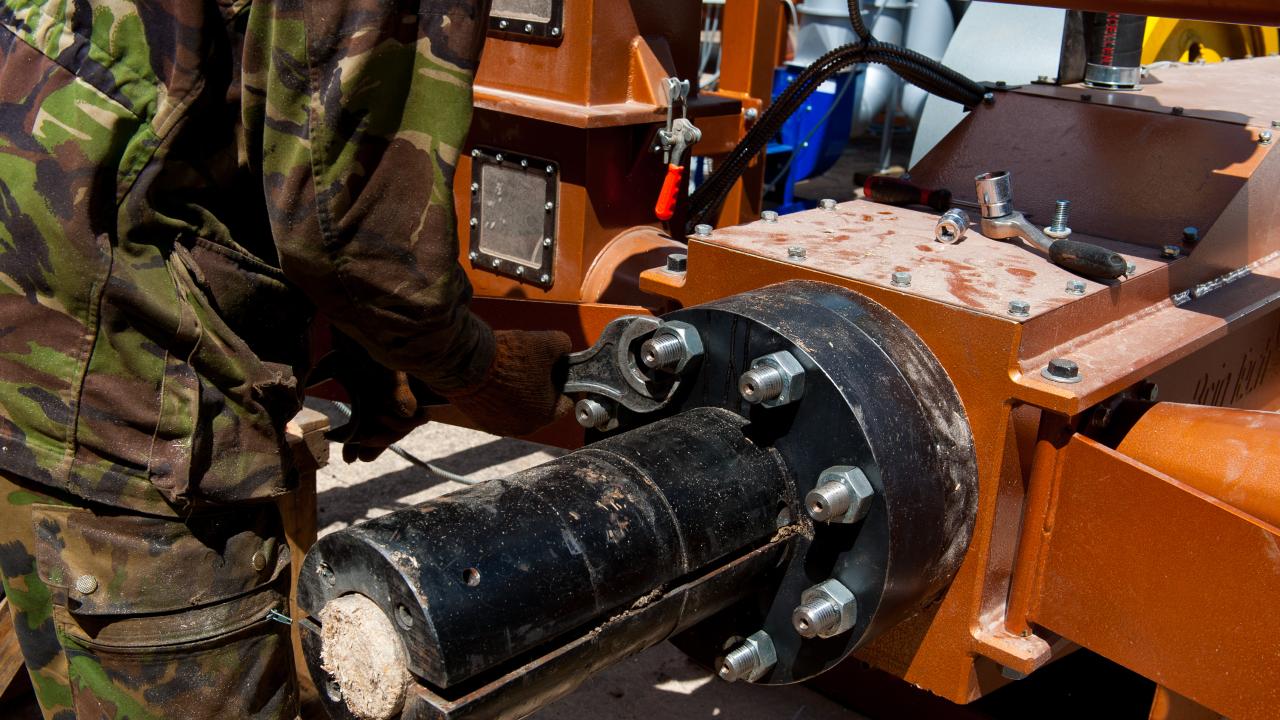
Specialized members of the Canadian Armed Forces
provide critical technological support for military armament as well as maintenance and inspection of all Army equipment.
On This Page

Full NOC Description
Specialized members of the Canadian Armed Forces provide critical technological support for military armament. They are primarily responsible for the maintenance, inspection and technical support of all Canadian Army equipment. They also follow the military and strategic policies established by the leadership of the Canadian Army, the Royal Canadian Airforce, and the Royal Canadian Navy.
Main Duties
This group performs some or all of the following duties:
- Certify ammunition, explosive items, munitions and non-munitions scrap to different degrees of classification
- Inspect, test, identify faults, adjust, repair, recondition and modify electrical, electromechanical, electronic, electro-optic and mechanical equipment, optical instruments, and control systems for weapons and missiles
- Maintain and repair machine-guns and non-guided anti-tank weapons, grenade projectors, mortars and launcher systems
- Test, inspect and repair air weapons systems
- Compile test logs, evaluation reports, equipment maintenance documentation and read and interpret electronic drawings.
Also Known As
- air weapons systems technician
- ammunition technician
- weapons engineering technician
- weapons technician
Employment Requirements
- Completion of secondary school is required.
- Three months of basic military training is required and provided.
- Occupational qualification training of at least two years is required.
- Specialized training in the operation and maintenance of military equipment and systems is provided.
Provincial Regulation
Not Provincially Regulated
The following graph shows the percentage of men and women working in this occupation in New Brunswick.
Data legend
The following graph shows the breakdown of all persons working in this occupation in New Brunswick by age group.
Data legend
The following graph shows the breakdown of all persons working in this occupation in New Brunswick by highest level of education achieved.
Data legend
The following graph shows the industry groups in which the largest shares of persons working in this occupation in New Brunswick are employed. Small percentages for all top three industry groups may suggest employment for this occupation is widely distributed amongst many industry groups.
Data legend
The following graph shows the breakdown of all persons employed in this occupation in New Brunswick by which economic region they reside in.
Data legend

Economic Regions
The following map displays New Brunswick’s five economic regions. An economic region (ER) is a grouping of counties, created as a standard unit for analysis of regional economic activity across Canada.
The following graph shows the average salary of all persons employed in this occupation in each of New Brunswick’s five economic regions.
Data legend
Economic Regions
The following map displays New Brunswick’s five economic regions. An economic region (ER) is a grouping of counties, created as a standard unit for analysis of regional economic activity across Canada.
The following represents the median hourly wage of all persons employed in this occupation in each of New Brunswick’s five economic regions.
The following shows the average salary of everyone who worked full-time and year-round in this occupation across each of the Atlantic Provinces and nationally.
The following represents the number of job openings that are expected to occur in this occupation over the next three and ten years respectively, broken down by openings expected to result from growth (“new jobs”) and openings expected to result from attrition (death and retirements).
Share this page
No endorsement of any products or services is expressed or implied.